

The average operating margin across US public companies is 12.82%, on a 37.76% gross margin and a 9.74% net profit margin, according to the NYU Stern (Aswath Damodaran) margins dataset for 5,994 firms, data as of January 2026. By industry, pre-tax operating margins run from 43.54% in tobacco and 35.33% in semiconductors down to −4.49% in consumer electronics, and net margins from 30.45% (semiconductors) to −10.83% (green and renewable energy). The median industry nets 7.25%.
Find your industry in the lookup below, then the full 94-row table. Private and small-business margins from IRS tax data, and a worked example for comparing your own numbers, follow.
Profit margin by industry: quick lookup
| Industry | Gross margin | Operating margin | Net margin |
|---|---|---|---|
| Software / SaaS | 71.72% | 32.98% | 25.49% |
| Semiconductors | 58.97% | 35.33% | 30.45% |
| IT and computer services | 24.26% | 7.41% | 4.45% |
| Consumer electronics | 38.77% | −4.49% | −9.42% |
| Machinery manufacturing | 37.47% | 15.86% | 10.58% |
| Engineering and construction | 15.46% | 6.49% | 5.94% |
| Homebuilding | 22.70% | 12.57% | 9.47% |
| Restaurants | 32.24% | 15.79% | 9.37% |
| General retail | 33.18% | 6.80% | 5.61% |
| Grocery retail | 26.31% | 2.29% | 1.32% |
| Distributors | 30.57% | 10.10% | 6.05% |
| Business and consumer services | 33.38% | 12.27% | 7.03% |
| Advertising and agencies | 36.24% | 10.07% | −0.30% |
| Soft drinks | 54.74% | 20.53% | 13.40% |
| Pharmaceuticals | 71.73% | 29.54% | 18.54% |
| Hospitals | 39.10% | 13.36% | 6.30% |
| Trucking | 21.19% | 6.89% | 3.79% |
| All US public companies | 37.76% | 12.82% | 9.74% |
Operating margin here is Damodaran’s pre-tax unadjusted operating margin, which is EBIT divided by revenue (the figure called marge d’EBIT in French and operative Marge in German). All industry figures are aggregates: total operating income of every firm in the industry divided by total revenue, so the largest companies carry the most weight.
Operating margin by industry: highest and lowest
The 5,994-firm aggregate operating margin is 12.82% (13.14% without financial firms). The median of the 91 non-bank industries is 12.27%. These are the 10 widest and 10 thinnest, with banks and brokerages excluded because they do not report operating income in the usual way.
| # | Highest operating margin | Margin | Lowest operating margin | Margin |
|---|---|---|---|---|
| 1 | Tobacco | 43.54% | Electronics (Consumer & Office) | −4.49% |
| 2 | Precious Metals | 40.39% | Coal & Related Energy | −4.02% |
| 3 | Retail (REITs) | 40.25% | Rubber & Tires | 2.24% |
| 4 | Transportation (Railroads) | 37.41% | Retail (Grocery and Food) | 2.29% |
| 5 | Semiconductor | 35.33% | Auto & Truck | 2.32% |
| 6 | Software (Entertainment) | 33.85% | Food Wholesalers | 2.61% |
| 7 | Utility (Water) | 33.72% | Chemical (Basic) | 2.67% |
| 8 | Software (System & Application) | 32.98% | Real Estate (Operations & Services) | 2.85% |
| 9 | Drugs (Pharmaceutical) | 29.54% | Healthcare Support Services | 3.00% |
| 10 | Semiconductor Equip | 26.17% | Chemical (Diversified) | 3.29% |
Watch the gap between operating and net margin. Alcoholic beverages earn a 22.76% operating margin but only 0.56% net, and green and renewable energy goes from 19.87% operating to −10.83% net. A gap that large usually points to interest, write-downs or one-off charges below the operating line, not weak pricing.
Full table: gross, operating and net margin for all 94 industries (January 2026)
Every row is copied from the NYU Stern (Aswath Damodaran) margins dataset, data as of January 2026, re-checked against the live file on October 30, 2026. Use Ctrl+F (Cmd+F on Mac) to jump to your industry. SG&A/sales is the share of revenue spent on selling, general and administrative costs, which is where most owner-controlled overhead sits.
| Industry | Firms | Gross margin | Operating margin (pre-tax) | Net margin | EBITDA / sales | SG&A / sales |
|---|---|---|---|---|---|---|
| Total Market | 5,994 | 37.76% | 12.82% | 9.74% | 16.56% | 15.94% |
| Total Market (without financials) | 4,822 | 34.39% | 13.14% | 8.56% | 17.42% | 13.97% |
| Advertising | 52 | 36.24% | 10.07% | −0.30% | 14.06% | 18.98% |
| Aerospace/Defense | 79 | 17.48% | 8.65% | 4.99% | 10.69% | 6.50% |
| Air Transport | 23 | 24.79% | 5.32% | 2.51% | 10.27% | 3.60% |
| Apparel | 35 | 56.88% | 9.11% | 3.85% | 11.47% | 47.62% |
| Auto & Truck | 33 | 10.41% | 2.32% | 1.29% | 7.49% | 6.26% |
| Auto Parts | 35 | 15.84% | 5.67% | 0.72% | 9.04% | 8.31% |
| Bank (Money Center) | 15 | 100.00% | n/m | 28.89% | n/m | 57.14% |
| Banks (Regional) | 568 | 99.62% | n/m | 27.49% | n/m | 52.37% |
| Beverage (Alcoholic) | 14 | 46.96% | 22.76% | 0.56% | 29.52% | 23.67% |
| Beverage (Soft) | 27 | 54.74% | 20.53% | 13.40% | 22.78% | 33.46% |
| Broadcasting | 24 | 38.13% | 12.33% | 2.06% | 18.21% | 21.34% |
| Brokerage & Investment Banking | 32 | 53.27% | n/m | 14.45% | n/m | 29.54% |
| Building Materials | 41 | 30.94% | 12.64% | 7.42% | 17.32% | 16.65% |
| Business & Consumer Services | 155 | 33.38% | 12.27% | 7.03% | 15.65% | 17.86% |
| Cable TV | 9 | 62.91% | 18.49% | 7.08% | 32.37% | 29.46% |
| Chemical (Basic) | 29 | 9.31% | 2.67% | −3.73% | 12.34% | 5.29% |
| Chemical (Diversified) | 4 | 15.32% | 3.29% | −5.35% | 9.68% | 10.44% |
| Chemical (Specialty) | 59 | 35.12% | 12.17% | 2.91% | 18.01% | 17.43% |
| Coal & Related Energy | 16 | 14.86% | −4.02% | −2.13% | 13.04% | 7.25% |
| Computer Services | 64 | 24.26% | 7.41% | 4.45% | 8.98% | 13.92% |
| Computers/Peripherals | 36 | 38.36% | 22.48% | 17.78% | 25.32% | 8.71% |
| Construction Supplies | 40 | 25.52% | 15.23% | 10.78% | 19.46% | 7.88% |
| Diversified | 20 | 25.81% | 22.73% | 16.37% | 31.27% | 2.39% |
| Drugs (Biotechnology) | 496 | 60.78% | 8.97% | −5.00% | 15.38% | 30.25% |
| Drugs (Pharmaceutical) | 228 | 71.73% | 29.54% | 18.54% | 33.59% | 21.91% |
| Education | 32 | 45.82% | 14.01% | 8.79% | 16.57% | 27.26% |
| Electrical Equipment | 112 | 31.82% | 9.53% | 0.94% | 12.65% | 18.41% |
| Electronics (Consumer & Office) | 8 | 38.77% | −4.49% | −9.42% | −2.65% | 26.48% |
| Electronics (General) | 114 | 26.76% | 10.42% | 6.47% | 12.36% | 11.67% |
| Engineering/Construction | 48 | 15.46% | 6.49% | 5.94% | 7.96% | 7.81% |
| Entertainment | 92 | 41.39% | 10.60% | 4.43% | 17.77% | 21.37% |
| Environmental & Waste Services | 53 | 36.30% | 14.61% | 8.24% | 20.99% | 14.00% |
| Farming/Agriculture | 35 | 13.09% | 5.45% | 3.91% | 8.04% | 6.09% |
| Financial Svcs. (Non-bank & Insurance) | 176 | 69.20% | 18.48% | 22.19% | 21.02% | 30.07% |
| Food Processing | 78 | 23.23% | 10.63% | 2.82% | 15.25% | 12.12% |
| Food Wholesalers | 13 | 15.44% | 2.61% | 1.17% | 3.71% | 12.40% |
| Furn/Home Furnishings | 27 | 30.28% | 6.59% | 1.10% | 9.75% | 22.43% |
| Green & Renewable Energy | 15 | 55.24% | 19.87% | −10.83% | 58.45% | 5.45% |
| Healthcare Information and Technology | 115 | 48.32% | 14.71% | 7.45% | 20.50% | 24.52% |
| Healthcare Products | 204 | 54.00% | 15.34% | 9.61% | 20.34% | 29.84% |
| Healthcare Support Services | 104 | 12.08% | 3.00% | 1.25% | 3.87% | 8.42% |
| Homebuilding | 30 | 22.70% | 12.57% | 9.47% | 14.14% | 9.89% |
| Hospitals/Healthcare Facilities | 31 | 39.10% | 13.36% | 6.30% | 15.80% | 4.41% |
| Hotel/Gaming | 63 | 60.85% | 19.39% | 10.38% | 24.45% | 28.23% |
| Household Products | 110 | 51.04% | 18.62% | 11.68% | 22.34% | 32.03% |
| Information Services | 15 | 34.08% | 11.89% | 6.53% | 17.28% | 17.67% |
| Insurance (General) | 21 | 44.70% | 21.31% | 12.37% | 23.57% | 9.63% |
| Insurance (Life) | 20 | 29.99% | 10.61% | 7.80% | 11.50% | 12.11% |
| Insurance (Prop/Cas.) | 57 | 30.19% | 15.25% | 11.13% | 14.73% | 10.26% |
| Investments & Asset Management | 283 | 69.77% | 25.50% | 18.36% | 11.65% | 27.81% |
| Machinery | 105 | 37.47% | 15.86% | 10.58% | 19.62% | 19.65% |
| Metals & Mining | 73 | 34.68% | 23.85% | 10.52% | 29.36% | 3.85% |
| Office Equipment & Services | 14 | 41.43% | 10.73% | 4.38% | 14.33% | 28.40% |
| Oil/Gas (Integrated) | 4 | 36.08% | 11.25% | 8.30% | 21.67% | 8.58% |
| Oil/Gas (Production and Exploration) | 142 | 57.19% | 25.42% | 14.63% | 43.21% | 5.18% |
| Oil/Gas Distribution | 23 | 43.37% | 25.78% | 13.35% | 32.74% | 6.88% |
| Oilfield Svcs/Equip. | 97 | 11.09% | 4.65% | 2.34% | 7.76% | 2.84% |
| Packaging & Container | 19 | 24.27% | 9.58% | 4.48% | 14.36% | 10.72% |
| Paper/Forest Products | 6 | 17.14% | 6.34% | 3.44% | 14.65% | 8.35% |
| Power | 46 | 43.57% | 21.47% | 12.73% | 35.33% | 2.31% |
| Precious Metals | 56 | 55.02% | 40.39% | 28.59% | 34.62% | 4.87% |
| Publishing & Newspapers | 19 | 50.44% | 9.98% | 8.19% | 13.18% | 33.95% |
| R.E.I.T. | 190 | 58.08% | 24.64% | 13.23% | 43.79% | 10.14% |
| Real Estate (Development) | 14 | 35.27% | 21.53% | 7.01% | 24.95% | 9.00% |
| Real Estate (General/Diversified) | 12 | 51.23% | 21.45% | 23.77% | 27.19% | 32.32% |
| Real Estate (Operations & Services) | 54 | 32.21% | 2.85% | 1.19% | 3.96% | 26.32% |
| Recreation | 49 | 39.79% | 9.69% | −4.72% | 16.64% | 23.83% |
| Reinsurance | 1 | 13.21% | 7.21% | 3.89% | 5.96% | 0.27% |
| Restaurant/Dining | 64 | 32.24% | 15.79% | 9.37% | 19.47% | 10.81% |
| Retail (Automotive) | 34 | 21.96% | 6.24% | 3.36% | 7.24% | 14.99% |
| Retail (Building Supply) | 14 | 34.22% | 11.94% | 7.84% | 14.21% | 20.46% |
| Retail (Distributors) | 62 | 30.57% | 10.10% | 6.05% | 11.37% | 18.73% |
| Retail (General) | 23 | 33.18% | 6.80% | 5.61% | 10.11% | 20.88% |
| Retail (Grocery and Food) | 15 | 26.31% | 2.29% | 1.32% | 5.40% | 21.69% |
| Retail (REITs) | 26 | 78.61% | 40.25% | 23.00% | 67.17% | 6.51% |
| Retail (Special Lines) | 94 | 35.30% | 7.73% | 5.19% | 9.85% | 26.88% |
| Rubber & Tires | 3 | 17.99% | 2.24% | −9.49% | 8.73% | 15.74% |
| Semiconductor | 66 | 58.97% | 35.33% | 30.45% | 36.77% | 6.17% |
| Semiconductor Equip | 31 | 46.32% | 26.17% | 21.32% | 29.06% | 8.90% |
| Shipbuilding & Marine | 8 | 27.08% | 12.60% | 9.48% | 20.41% | 9.15% |
| Shoe | 11 | 43.88% | 9.03% | 6.27% | 11.87% | 34.58% |
| Software (Entertainment) | 77 | 66.45% | 33.85% | 29.93% | 34.90% | 14.15% |
| Software (Internet) | 29 | 62.58% | 3.69% | −0.93% | 9.52% | 33.35% |
| Software (System & Application) | 309 | 71.72% | 32.98% | 25.49% | 35.93% | 24.38% |
| Steel | 19 | 12.25% | 4.10% | 1.93% | 10.58% | 7.19% |
| Telecom (Wireless) | 12 | 62.98% | 20.98% | 12.24% | 34.57% | 26.65% |
| Telecom. Equipment | 57 | 58.14% | 20.70% | 16.09% | 23.95% | 21.59% |
| Telecom. Services | 39 | 58.82% | 20.47% | 14.20% | 34.70% | 22.42% |
| Tobacco | 10 | 64.31% | 43.54% | 26.65% | 42.22% | 20.74% |
| Transportation | 19 | 24.10% | 7.57% | 8.23% | 9.83% | 5.03% |
| Transportation (Railroads) | 4 | 50.96% | 37.41% | 24.73% | 49.19% | 0.01% |
| Trucking | 26 | 21.19% | 6.89% | 3.79% | 15.58% | 6.22% |
| Utility (General) | 14 | 44.18% | 23.49% | 14.18% | 34.92% | −0.93% |
| Utility (Water) | 14 | 58.97% | 33.72% | 21.16% | 45.73% | 3.87% |
Small samples move fast. Rubber and tires has 3 firms, railroads and diversified chemicals have 4 each, and reinsurance has 1, so one company can swing those rows. The source also offers the same data as a downloadable Excel file with lease-adjusted and R&D-adjusted margins.
Industries with the highest and lowest net profit margins
Semiconductors (30.45%), entertainment software (29.93%) and money center banks (28.89%) keep the most of each sales dollar. Ten of the 94 industries lost money in aggregate, led by green and renewable energy (−10.83%), rubber and tires (−9.49%) and consumer electronics (−9.42%). Bank margins sit on a different revenue definition (gross margin is reported as 100.00%), so do not compare them with operating companies.
Margins for the industries people ask about
Tech company profit margins and gross margin for technology
Tech margins depend on whether the company sells code, chips or hours. Public software (system and application) companies run a 71.72% gross margin, 32.98% operating margin and 25.49% net across 309 firms. Before stock-based compensation the software operating margin is 40.81%, because stock pay costs these firms 7.83% of revenue. That pre-SBC figure is the one many SaaS investors quote, so check which one a benchmark uses.
| Tech segment | Gross | Operating | Net | R&D / sales |
|---|---|---|---|---|
| Software (System & Application) | 71.72% | 32.98% | 25.49% | 15.98% |
| Software (Entertainment) | 66.45% | 33.85% | 29.93% | 18.61% |
| Software (Internet) | 62.58% | 3.69% | −0.93% | 19.76% |
| Semiconductor | 58.97% | 35.33% | 30.45% | 15.36% |
| Semiconductor Equip | 46.32% | 26.17% | 21.32% | 10.72% |
| Computers/Peripherals | 38.36% | 22.48% | 17.78% | 7.08% |
| Computer Services | 24.26% | 7.41% | 4.45% | 2.53% |
| Healthcare Information and Technology | 48.32% | 14.71% | 7.45% | 6.89% |
| Information Services | 34.08% | 11.89% | 6.53% | 2.08% |
What is a good gross margin for a technology company? For software, the public aggregate is 71.72%, so a SaaS business below about 70% gross is under the public norm. For IT services the bar is far lower: computer services firms keep 24.26% gross and 4.45% net, because labor is their cost of goods. Internet software shows why gross margin alone misleads: 62.58% gross, but SG&A of 33.35% and R&D of 19.76% leave a −0.93% net margin.
Consumer electronics profit margin
Consumer and office electronics makers posted a 38.77% gross margin, −4.49% operating margin and −9.42% net margin in the January 2026 file. That is only 8 firms (down from 11 in January 2025, when net was −15.37%), and R&D eats 17.90% of revenue. Two neighbors give a fuller picture: computers and peripherals (38.36% gross, 17.78% net) and general electronics (26.76% gross, 6.47% net). On the retail side, IRS data shows sole-proprietor electronics and appliance retailers netting 5.5% of receipts in tax year 2023.
Average profit margin for manufacturing
Damodaran has no single manufacturing row, so pick the closest sub-industry. Margins split sharply by what is made:
| Manufacturing segment | Gross | Operating | Net |
|---|---|---|---|
| Machinery | 37.47% | 15.86% | 10.58% |
| Electrical Equipment | 31.82% | 9.53% | 0.94% |
| Building Materials | 30.94% | 12.64% | 7.42% |
| Chemical (Specialty) | 35.12% | 12.17% | 2.91% |
| Food Processing | 23.23% | 10.63% | 2.82% |
| Aerospace/Defense | 17.48% | 8.65% | 4.99% |
| Auto Parts | 15.84% | 5.67% | 0.72% |
| Packaging & Container | 24.27% | 9.58% | 4.48% |
| Steel | 12.25% | 4.10% | 1.93% |
For small manufacturers, IRS tax year 2023 data puts sole-proprietor manufacturing at a 7.1% net margin before owner pay, ranging from −1.2% in food manufacturing to 16.7% in machinery. If you sell into this sector, the industrial B2B marketing playbook covers how buyers in these segments evaluate suppliers.
Construction gross profit margin benchmarks
Public engineering and construction firms run a thin 15.46% gross margin, 6.49% operating margin and 5.94% net. Homebuilders do better at 22.70% gross and 9.47% net, and construction supplies at 25.52% gross and 10.78% net. Small contractors look very different on paper because the owner’s pay sits inside net income. IRS sole-proprietor returns for tax year 2023 show:
| Construction segment | Returns | Receipts | Net margin (owner pay included) |
|---|---|---|---|
| All construction | 3,368,860 | $382.5 billion | 14.8% |
| Building construction | 795,086 | $113.9 billion | 13.2% |
| Heavy and civil engineering | 52,258 | $10.9 billion | 11.2% |
| Specialty trade contractors (HVAC, plumbing, electrical, roofing) | 2,521,516 | $257.8 billion | 15.7% |
A commercial HVAC contractor sits inside specialty trade contractors. The 15.7% figure has to cover the owner’s salary, so subtract a market wage for yourself before comparing it with the public 6.49% operating margin. The HVAC niche selection guide shows how service mix changes that number.
Restaurant, retail and distributor margins
| Industry | Gross | Operating | Net |
|---|---|---|---|
| Restaurant/Dining | 32.24% | 15.79% | 9.37% |
| Retail (General) | 33.18% | 6.80% | 5.61% |
| Retail (Special Lines) | 35.30% | 7.73% | 5.19% |
| Retail (Grocery and Food) | 26.31% | 2.29% | 1.32% |
| Retail (Building Supply) | 34.22% | 11.94% | 7.84% |
| Retail (Automotive) | 21.96% | 6.24% | 3.36% |
| Retail (Distributors) | 30.57% | 10.10% | 6.05% |
| Food Wholesalers | 15.44% | 2.61% | 1.17% |
Public restaurant chains net 9.37%, but independent operators do far worse: sole-proprietor restaurants and bars netted 3.4% of receipts in tax year 2023, before paying the owner. Distributor margins follow the same pattern: 6.05% net for public distributors, 8.5% for sole-proprietor merchant wholesalers, and just 1.17% for public food wholesalers.
Advertising, agency and business services margins
Public advertising companies (52 firms) show a 36.24% gross margin, 10.07% operating margin and −0.30% net, down from 3.00% net a year earlier. Business and consumer services (155 firms) run 33.38% gross, 12.27% operating and 7.03% net. Owner-run service firms report much higher net margins on tax returns because the owner’s labor is the main cost:
| Service business | Returns | Net margin (owner pay included) |
|---|---|---|
| Management consulting | 1,109,907 | 50.2% |
| CPA firms | 28,476 | 44.8% |
| Legal services | 316,370 | 43.8% |
| Computer systems design | 318,183 | 37.0% |
| Advertising and related services | 179,434 | 27.4% |
| Architectural services | 139,796 | 17.3% |
| All professional services | 3,912,417 | 39.7% |
A consultant netting 50% as a sole proprietor and an agency netting 10% after salaries can be equally healthy. Strip out a market salary for the owner before you compare. The US advertising industry statistics page covers agency revenue and employment.
Soft drink (beverage) gross margin
Soft beverage companies keep a 54.74% gross margin, 20.53% operating margin and 13.40% net in the January 2026 file (27 firms). The January 2025 file showed 54.90% gross, 20.01% operating and 14.07% net across 29 firms. Alcoholic beverages run 46.96% gross but only 0.56% net.
Gross vs net margin for common small-business models
Small business profit margin by industry: IRS data on private firms
Damodaran’s data covers public companies only. For private firms, the best primary source is IRS Statistics of Income, which estimates income statements from large samples of business tax returns. Two tables matter. The corporation report (C and S corporations, tax year 2023) breaks margins out by company size, and the sole proprietorship table breaks them out by industry.
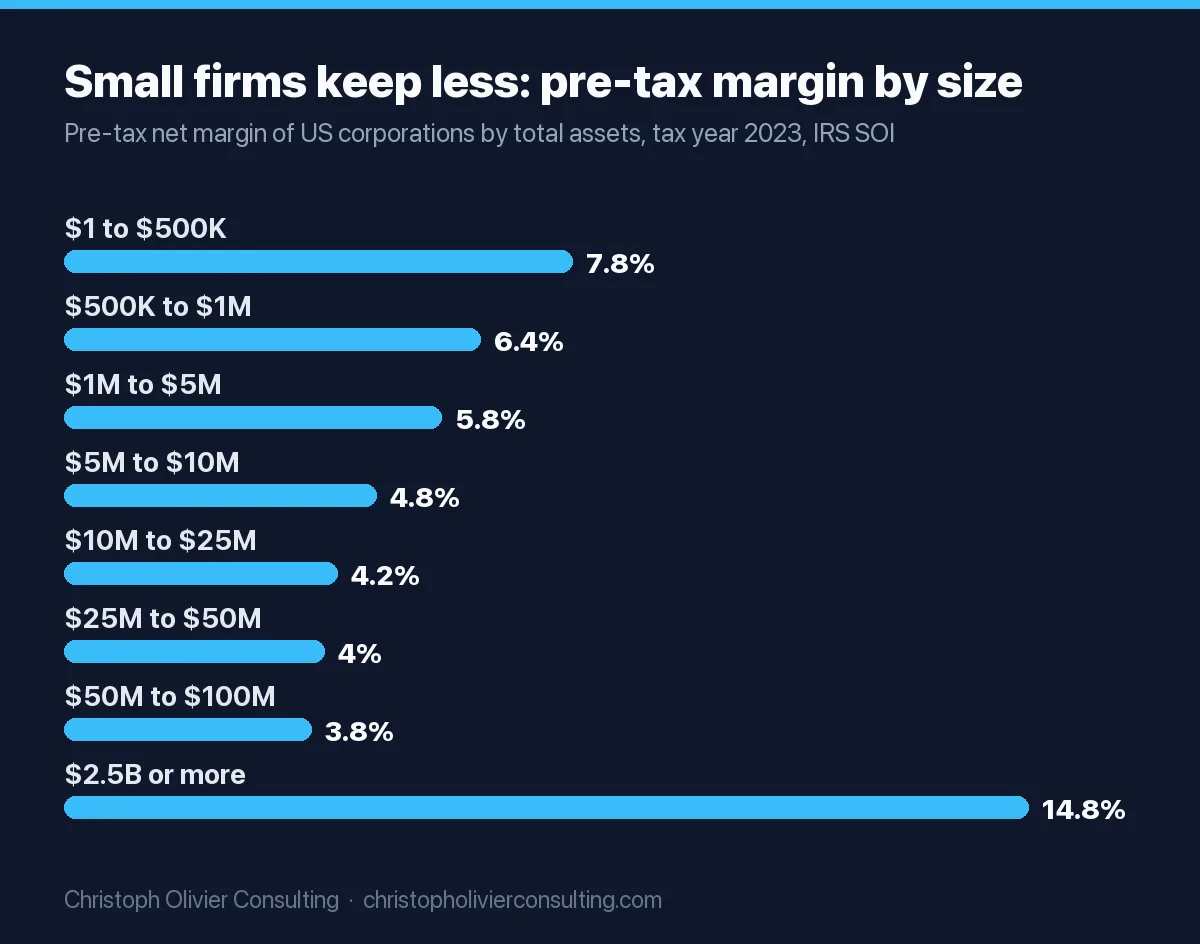
| Company size (total assets) | Returns | Gross margin | Pre-tax net margin | Officer pay / sales |
|---|---|---|---|---|
| $1 to under $500,000 | 4,118,984 | 63.7% | 7.8% | 8.2% |
| $500,000 to under $1 million | 542,187 | 54.8% | 6.4% | 5.2% |
| $1 million to under $5 million | 619,565 | 48.4% | 5.8% | 3.9% |
| $5 million to under $10 million | 106,481 | 37.0% | 4.8% | 2.4% |
| $10 million to under $25 million | 78,637 | 33.3% | 4.2% | 1.8% |
| $25 million to under $50 million | 31,986 | 31.3% | 4.0% | 1.4% |
| $500 million to under $2.5 billion | 10,076 | 37.0% | 8.0% | 0.7% |
| $2.5 billion or more | 4,962 | 37.4% | 14.8% | 0.3% |
| All corporations | 7,031,498 | 39.3% | 11.1% | 1.4% |
Three things stand out. Small corporations have higher gross margins (63.7% under $500,000 of assets), likely because many are service firms with little cost of goods, but lower pre-tax net margins (7.8% falling to 4.2% at $10 million to $25 million) than the largest companies (14.8%). Officer pay takes 8.2% of sales at the smallest firms versus 0.3% at the largest, which is the owner’s salary showing up as an expense. These margins are before corporate income tax. S corporations pay no entity-level income tax, so for an S corporation the pre-tax figure is also the entity’s bottom line.
Sole proprietor profit margin by industry (tax year 2023)
| Industry | Returns | Receipts | Net margin |
|---|---|---|---|
| All industries | 31,125,909 | $2,063.2 billion | 18.3% |
| Professional, scientific and technical | 3,912,417 | $250.2 billion | 39.7% |
| Health care | 2,468,353 | $147.5 billion | 34.9% |
| Dentists | 56,157 | $18.0 billion | 27.1% |
| Real estate | 1,410,808 | $100.0 billion | 27.2% |
| Finance and insurance | 708,558 | $121.2 billion | 20.2% |
| Insurance agencies | 313,543 | $33.1 billion | 36.1% |
| Information | 474,628 | $16.6 billion | 24.6% |
| Administrative and support services | 3,118,914 | $114.4 billion | 21.2% |
| Other services (repair, personal care) | 4,066,467 | $164.8 billion | 18.9% |
| Auto repair | 465,852 | $41.3 billion | 8.0% |
| Construction | 3,368,860 | $382.5 billion | 14.8% |
| Trucking | 837,211 | $114.4 billion | 10.1% |
| Wholesale trade | 457,822 | $75.2 billion | 8.5% |
| Manufacturing | 417,440 | $46.2 billion | 7.1% |
| Retail trade | 2,276,668 | $199.5 billion | 4.1% |
| Accommodation and food services | 738,481 | $84.8 billion | 1.9% |
The 18.3% all-industry figure covers 31.1 million returns, most of them one-person businesses. Read it as owner earnings, not profit after a salary. The sole proprietorship table has no cost of goods line, so it cannot give you a small-business gross margin by sector; for that, use the public rows or a trade association survey for your niche. For how many new businesses enter each sector, see the business formation statistics.
How to calculate your profit margin and compare it (worked example)
- Gross margin = (revenue minus cost of goods sold) / revenue. Cost of goods sold is the direct cost of delivery: materials, subcontractors, field or billable labor.
- Operating margin = operating income (EBIT) / revenue. Operating income is gross profit minus overhead: office staff, rent, software, marketing and owner salary.
- Net margin = net income / revenue, after interest and income tax.
- Markup = gross margin / (1 minus gross margin). A 30% margin is a 42.9% markup. Price a job at a 30% markup and you get a 23.1% margin, not 30%.
Example: a specialty trade contractor (S corporation) with $1.8 million in revenue.
| Line | Amount | % of revenue |
|---|---|---|
| Revenue | $1,800,000 | 100.0% |
| Cost of goods sold (materials, equipment, field labor) | $1,260,000 | 70.0% |
| Gross profit | $540,000 | 30.0% |
| Overhead, including $120,000 owner salary | $360,000 | 20.0% |
| Operating income (EBIT) | $180,000 | 10.0% |
| Interest on equipment loans | $18,000 | 1.0% |
| Pre-tax income | $162,000 | 9.0% |
Now compare each line with the right benchmark:
- Against public engineering and construction (15.46% gross, 6.49% operating): the 10.0% operating margin is ahead. The 30.0% gross margin is not directly comparable, because companies choose differently which costs (supervision, equipment, subcontractors) sit in cost of goods, so gross margin moves with accounting choices more than operating margin does.
- Against IRS sole-proprietor specialty trade contractors (15.7% net with owner pay included): add the $120,000 salary back to pre-tax income. $282,000 / $1,800,000 = 15.7%, right at the IRS figure.
- Against IRS corporations with $1 million to $5 million in assets (5.8% pre-tax net, all industries): 9.0% is well above the size-group norm.
Normalize owner pay first. If this owner took a $50,000 salary when a hired general manager would cost $120,000, reported operating income would be $250,000 (13.9%). Subtract the $70,000 gap before comparing, or the business looks stronger than a buyer will see it. Buyers price on this normalized figure, as the home services EBITDA multiples show.
Then test price before cost. A 3% price increase with no lost volume lifts revenue to $1,854,000 while cost of goods and overhead stay put. Gross profit becomes $594,000 (32.0%) and operating income $234,000 (12.6%): a 30% jump in operating profit from a 3% price change. A 3% discount does the reverse and cuts operating income to $126,000. The pricing strategy guide covers how to raise prices without losing the clients you want.
Margin gap diagnostic: where your margin is leaking
| What you see | Likely cause | First move |
|---|---|---|
| Gross margin 5+ points below your row | Pricing, cost of goods, or scope creep | Reprice new work first; audit the 10 least profitable jobs or clients |
| Gross margin on par, operating margin 3+ points below | Overhead (compare your SG&A / sales with the table: 15.94% for all firms, 17.86% for business services) | Cut or reassign overhead; check marketing cost per customer |
| Operating margin on par, net margin well below | Interest, debt load or tax structure | Refinance or pay down expensive debt; review entity type with your CPA |
| All three above benchmark | Possibly under-paid owner or under-investment | Normalize owner pay and check that growth spending is not starved |
If the leak is marketing, compare your acquisition cost with the CAC benchmarks by industry. If you want a second pair of eyes on pricing and margin, you can book a consultation.
Margins by sector (US): January 2025 data vs January 2026
Damodaran replaces the file each January, so the January 2025 numbers no longer appear on the live margins page. They are preserved in an Internet Archive capture of the margins page (data used is as of January 2025, 6,062 firms), and older years are on his archived data page. In January 2025 the total market showed a 37.11% gross margin, 12.08% operating margin, 8.67% net margin and 15.95% EBITDA to sales. A year later net margin had risen to 9.74%.
| Industry | Firms (2025) | Gross 2025 | Operating 2025 | Net 2025 | EBITDA / sales 2025 | Net 2026 | Change (pts) |
|---|---|---|---|---|---|---|---|
| Total Market | 6,062 | 37.11% | 12.08% | 8.67% | 15.95% | 9.74% | +1.07 |
| Total Market (without financials) | 4,935 | 32.39% | 11.93% | 7.33% | 16.12% | 8.56% | +1.23 |
| Advertising | 54 | 29.91% | 10.90% | 3.00% | 13.72% | −0.30% | −3.30 |
| Aerospace/Defense | 67 | 17.05% | 7.59% | 4.37% | 11.22% | 4.99% | +0.62 |
| Air Transport | 24 | 24.96% | 5.54% | 2.21% | 11.03% | 2.51% | +0.30 |
| Apparel | 37 | 54.28% | 8.73% | 2.98% | 11.79% | 3.85% | +0.87 |
| Auto & Truck | 34 | 11.11% | 3.13% | 3.77% | 7.04% | 1.29% | −2.48 |
| Auto Parts | 33 | 15.21% | 5.10% | 2.27% | 8.70% | 0.72% | −1.55 |
| Bank (Money Center) | 15 | NA | NA | NA | NA | 28.89% | |
| Banks (Regional) | 591 | NA | NA | NA | NA | 27.49% | |
| Beverage (Alcoholic) | 18 | 46.53% | 22.85% | 9.29% | 26.04% | 0.56% | −8.73 |
| Beverage (Soft) | 29 | 54.90% | 20.01% | 14.07% | 22.19% | 13.40% | −0.67 |
| Broadcasting | 22 | 39.84% | 12.51% | −5.64% | 14.18% | 2.06% | +7.70 |
| Brokerage & Investment Banking | 30 | NA | NA | NA | NA | 14.45% | |
| Building Materials | 39 | 32.05% | 13.34% | 10.56% | 16.56% | 7.42% | −3.14 |
| Business & Consumer Services | 152 | 33.70% | 12.11% | 7.09% | 15.41% | 7.03% | −0.06 |
| Cable TV | 9 | 57.89% | 18.46% | 7.58% | 31.60% | 7.08% | −0.50 |
| Chemical (Basic) | 31 | 12.54% | 6.05% | 2.76% | 12.67% | −3.73% | −6.49 |
| Chemical (Diversified) | 4 | 16.47% | 4.36% | −0.50% | 12.00% | −5.35% | −4.85 |
| Chemical (Specialty) | 60 | 33.77% | 11.93% | 6.46% | 19.09% | 2.91% | −3.55 |
| Coal & Related Energy | 16 | 25.07% | 10.97% | 10.06% | 31.73% | −2.13% | −12.19 |
| Computer Services | 63 | 24.14% | 6.06% | 4.15% | 9.66% | 4.45% | +0.30 |
| Computers/Peripherals | 35 | 38.72% | 22.65% | 16.78% | 25.46% | 17.78% | +1.00 |
| Construction Supplies | 46 | 25.98% | 15.13% | 11.23% | 18.40% | 10.78% | −0.45 |
| Diversified | 21 | 36.46% | 32.85% | 25.15% | 33.43% | 16.37% | −8.78 |
| Drugs (Biotechnology) | 535 | 56.02% | 1.42% | −13.20% | 10.91% | −5.00% | +8.20 |
| Drugs (Pharmaceutical) | 231 | 70.30% | 22.81% | 8.90% | 28.92% | 18.54% | +9.64 |
| Education | 29 | 41.15% | 9.24% | 2.65% | 10.87% | 8.79% | +6.14 |
| Electrical Equipment | 101 | 30.09% | 7.15% | 2.59% | 10.88% | 0.94% | −1.65 |
| Electronics (Consumer & Office) | 11 | 37.48% | −5.30% | −15.37% | −2.60% | −9.42% | +5.95 |
| Electronics (General) | 122 | 25.19% | 8.15% | 5.62% | 12.53% | 6.47% | +0.85 |
| Engineering/Construction | 42 | 14.45% | 5.57% | 2.95% | 7.21% | 5.94% | +2.99 |
| Entertainment | 96 | 39.68% | 8.34% | −3.16% | 16.15% | 4.43% | +7.59 |
| Environmental & Waste Services | 50 | 35.79% | 14.89% | 8.81% | 20.53% | 8.24% | −0.57 |
| Farming/Agriculture | 35 | 14.70% | 7.25% | 4.90% | 10.96% | 3.91% | −0.99 |
| Financial Svcs. (Non-bank & Insurance) | 166 | 68.37% | 16.33% | 22.28% | 18.17% | 22.19% | −0.09 |
| Food Processing | 77 | 25.91% | 11.97% | 6.01% | 14.59% | 2.82% | −3.19 |
| Food Wholesalers | 14 | 15.36% | 2.67% | 1.34% | 3.69% | 1.17% | −0.17 |
| Furn/Home Furnishings | 28 | 28.50% | 6.51% | 2.11% | 9.61% | 1.10% | −1.01 |
| Green & Renewable Energy | 18 | 58.55% | 21.60% | −18.83% | 54.58% | −10.83% | +8.00 |
| Healthcare Information and Technology | 116 | 47.76% | 13.35% | 4.69% | 20.87% | 7.45% | +2.76 |
| Healthcare Products | 218 | 56.04% | 14.81% | 8.73% | 20.86% | 9.61% | +0.88 |
| Healthcare Support Services | 113 | 13.16% | 3.44% | 1.58% | 4.51% | 1.25% | −0.33 |
| Homebuilding | 30 | 24.97% | 15.52% | 12.00% | 15.51% | 9.47% | −2.53 |
| Hospitals/Healthcare Facilities | 33 | 38.25% | 12.45% | 6.97% | 15.32% | 6.30% | −0.67 |
| Hotel/Gaming | 65 | 61.37% | 18.15% | 9.80% | 23.25% | 10.38% | +0.58 |
| Household Products | 101 | 51.32% | 18.38% | 10.38% | 21.47% | 11.68% | +1.30 |
| Information Services | 16 | 33.82% | 11.54% | 6.23% | 16.98% | 6.53% | +0.30 |
| Insurance (General) | 22 | 36.83% | 16.43% | 4.16% | 21.61% | 12.37% | +8.21 |
| Insurance (Life) | 19 | 26.04% | 8.21% | 5.95% | 6.23% | 7.80% | +1.85 |
| Insurance (Prop/Cas.) | 53 | 28.24% | 13.63% | 9.88% | 9.44% | 11.13% | +1.25 |
| Investments & Asset Management | 231 | 63.89% | 14.49% | 17.59% | 12.07% | 18.36% | +0.77 |
| Machinery | 109 | 37.08% | 15.79% | 10.04% | 18.67% | 10.58% | +0.54 |
| Metals & Mining | 64 | 34.21% | 22.62% | 7.39% | 25.63% | 10.52% | +3.13 |
| Office Equipment & Services | 14 | 37.29% | 8.17% | 1.06% | 11.21% | 4.38% | +3.32 |
| Oil/Gas (Integrated) | 4 | 35.60% | 13.43% | 9.75% | 22.44% | 8.30% | −1.45 |
| Oil/Gas (Production and Exploration) | 147 | 58.78% | 29.54% | 19.52% | 53.27% | 14.63% | −4.89 |
| Oil/Gas Distribution | 24 | 46.68% | 28.06% | 16.24% | 47.19% | 13.35% | −2.89 |
| Oilfield Svcs/Equip. | 97 | 10.71% | 4.99% | 3.31% | 10.75% | 2.34% | −0.97 |
| Packaging & Container | 22 | 22.64% | 9.79% | 6.82% | 16.12% | 4.48% | −2.34 |
| Paper/Forest Products | 6 | 19.98% | 10.13% | 6.53% | 14.26% | 3.44% | −3.09 |
| Power | 48 | 41.63% | 19.75% | 11.30% | 32.82% | 12.73% | +1.43 |
| Precious Metals | 60 | 37.76% | 18.83% | −4.84% | 20.12% | 28.59% | +33.43 |
| Publishing & Newspapers | 19 | 47.91% | 8.30% | 2.26% | 12.35% | 8.19% | +5.93 |
| R.E.I.T. | 192 | 57.66% | 24.48% | 12.53% | 44.60% | 13.23% | +0.70 |
| Real Estate (Development) | 15 | 35.13% | 14.74% | 11.12% | 18.23% | 7.01% | −4.11 |
| Real Estate (General/Diversified) | 11 | 45.51% | 11.07% | 8.64% | 19.14% | 23.77% | +15.13 |
| Real Estate (Operations & Services) | 60 | 33.61% | 1.39% | −0.79% | 3.20% | 1.19% | +1.98 |
| Recreation | 50 | 38.81% | 9.04% | 0.65% | 14.63% | −4.72% | −5.37 |
| Reinsurance | 1 | 10.88% | 5.51% | 3.32% | 6.67% | 3.89% | +0.57 |
| Restaurant/Dining | 62 | 32.90% | 15.96% | 10.62% | 19.56% | 9.37% | −1.25 |
| Retail (Automotive) | 29 | 22.31% | 6.01% | 3.33% | 7.39% | 3.36% | +0.03 |
| Retail (Building Supply) | 13 | 34.15% | 12.12% | 8.08% | 14.97% | 7.84% | −0.24 |
| Retail (Distributors) | 66 | 30.82% | 10.56% | 6.45% | 12.13% | 6.05% | −0.40 |
| Retail (General) | 24 | 32.22% | 6.20% | 4.60% | 8.62% | 5.61% | +1.01 |
| Retail (Grocery and Food) | 17 | 26.09% | 3.33% | 1.97% | 4.60% | 1.32% | −0.65 |
| Retail (REITs) | 28 | 77.48% | 38.88% | 25.47% | 64.43% | 23.00% | −2.47 |
| Retail (Special Lines) | 98 | 30.39% | 5.10% | 1.49% | 6.82% | 5.19% | +3.70 |
| Rubber & Tires | 3 | 19.72% | 4.04% | −1.70% | 7.81% | −9.49% | −7.79 |
| Semiconductor | 63 | 58.59% | 29.71% | 19.96% | 31.32% | 30.45% | +10.49 |
| Semiconductor Equip | 30 | 45.35% | 24.06% | 20.14% | 27.81% | 21.32% | +1.18 |
| Shipbuilding & Marine | 8 | 27.71% | 13.74% | 10.52% | 15.82% | 9.48% | −1.04 |
| Shoe | 12 | 47.10% | 12.82% | 10.15% | 15.35% | 6.27% | −3.88 |
| Software (Entertainment) | 81 | 65.38% | 32.37% | 27.43% | 30.33% | 29.93% | +2.50 |
| Software (Internet) | 29 | 60.82% | 1.31% | −2.60% | 7.75% | −0.93% | +1.67 |
| Software (System & Application) | 333 | 72.38% | 28.63% | 22.94% | 33.84% | 25.49% | +2.55 |
| Steel | 27 | 15.61% | 7.61% | 5.25% | 15.99% | 1.93% | −3.32 |
| Telecom (Wireless) | 11 | 62.35% | 20.15% | 10.81% | 33.31% | 12.24% | +1.43 |
| Telecom. Equipment | 61 | 56.96% | 17.49% | 10.48% | 22.89% | 16.09% | +5.61 |
| Telecom. Services | 32 | 59.32% | 20.35% | 5.87% | 34.47% | 14.20% | +8.33 |
| Tobacco | 12 | 61.96% | 41.05% | 31.96% | 42.77% | 26.65% | −5.31 |
| Transportation | 21 | 23.17% | 6.83% | 4.09% | 11.33% | 8.23% | +4.14 |
| Transportation (Railroads) | 4 | 51.68% | 38.31% | 24.30% | 46.71% | 24.73% | +0.43 |
| Trucking | 24 | 20.72% | 6.97% | 4.20% | 15.48% | 3.79% | −0.41 |
| Utility (General) | 14 | 44.53% | 23.28% | 15.46% | 39.12% | 14.18% | −1.28 |
| Utility (Water) | 15 | 58.92% | 33.11% | 21.32% | 44.57% | 21.16% | −0.16 |
For example, the January 2025 advertising row reads 54 firms, 29.91% gross, 3.00% net and 13.72% EBITDA to sales. Software (system and application) read 333 firms, 72.38% gross, 28.63% operating and 22.94% net. When you cite a figure, cite the year of the file, because rows change by several points from one January to the next.
How to read and cite the Damodaran margin data
- Which operating margin? The file has seven operating margin columns. This page uses pre-tax unadjusted operating margin. The pre-tax, pre-stock-compensation version adds back stock pay (14.39% for the total market vs 12.82% unadjusted). Lease-adjusted and R&D-adjusted versions treat leases and R&D as capital items.
- Trailing data. The January 2026 file is built from the most recent financials available at the start of 2026, so it mostly reflects 2025 results.
- Aggregate, not average. Each row sums the income of all firms and divides by summed revenue. The median industry net margin (7.25%) is below the total-market 9.74% because large, highly profitable firms dominate the total.
- Do not blend sources. IRS, Damodaran and trade surveys define revenue, cost of goods and profit differently. Compare within one source.
To cite a figure, name the dataset and year: Damodaran, A., “Operating and Net Margins by Sector (US),” NYU Stern, January 2026. Cite this page for the operating margin rankings, the IRS size and industry calculations, and the year-over-year changes.
Frequently asked questions
What is the average operating margin by industry?
Across 5,994 US public companies the aggregate pre-tax operating margin is 12.82% (NYU Stern, Damodaran, data as of January 2026), and the median of the 91 non-bank industries is 12.27%. The widest are tobacco at 43.54%, precious metals at 40.39% and retail REITs at 40.25%. The thinnest are consumer electronics at -4.49% and coal at -4.02%.
What is the average net profit margin by industry?
The all-company net margin is 9.74% in the January 2026 Damodaran file (8.56% excluding financial firms), and the median industry nets 7.25%. Common benchmarks: software 25.49%, restaurants 9.37%, business and consumer services 7.03%, engineering and construction 5.94%, general retail 5.61% and grocery 1.32%.
Which industry has the highest profit margin?
Semiconductors have the highest net margin of the 94 US industries at 30.45%, followed by entertainment software at 29.93%, money center banks at 28.89% and precious metals at 28.59% (NYU Stern, January 2026). By operating margin, tobacco leads at 43.54%. Ten industries lost money in aggregate, led by green and renewable energy at -10.83%.
What is the average profit margin for a small business?
IRS data for tax year 2023 shows US corporations with $1 million to $5 million in assets earning a 5.8% pre-tax net margin on a 48.4% gross margin, and those under $500,000 in assets 7.8%. Sole proprietors net 18.3% of receipts, but that figure includes the owner's pay, so subtract a market salary before comparing.
What does Damodaran's margins by sector (US) January 2025 file show?
The January 2025 file (6,062 firms) showed a 37.11% gross margin, 12.08% operating margin, 8.67% net margin and 15.95% EBITDA to sales for the total market. Advertising read 54 firms, 29.91% gross, 3.00% net and 13.72% EBITDA to sales. It was replaced by the January 2026 file and survives in an Internet Archive capture.
What is a good gross margin for a technology company?
Public software companies average a 71.72% gross margin, semiconductors 58.97% and internet software 62.58% (NYU Stern, January 2026). IT and computer services firms keep only 24.26% because labor is their cost of goods. A SaaS business below about 70% gross is under the public software norm, while an IT services firm near 25% is typical.
What is the difference between margin and markup?
Margin is profit divided by price; markup is profit divided by cost. Markup equals gross margin divided by one minus gross margin, so a 30% gross margin is a 42.9% markup, and a 30% markup is only a 23.1% margin. Industry tables like Damodaran's report margins, so convert your markup before you compare.