

Paid media takes about 31% of the average marketing budget. Gartner’s 2026 CMO Spend Survey puts it at 31.4%, up from 30.6% in 2025, when it worked out to 2.4% of company revenue. The total marketing budget itself runs 7.8% of revenue at large enterprises (Gartner 2026) and 9.0% of revenue across U.S. companies (The CMO Survey 2026), with smaller firms and consumer brands spending well above that and the median company spending just 5%.
Every number below comes from the latest edition of each source, read from the source itself: the Gartner press releases, the three free PDF reports of the 35th CMO Survey, the IAB/PwC revenue reports and SaaS Capital’s spending survey. Where a figure rests on a small sample, the sample size is printed next to it.
What percentage of marketing budget should go to paid media?
The benchmark is 30% to 31% of the marketing budget, and it has risen every year Gartner has published it. In the 2026 survey, reported by Chief Marketer, paid media reached a five-year high of 31.4%, against 25.1% in 2021. It is the largest single line in the budget, ahead of labor and marketing technology.
| Budget category (share of marketing budget) | 2021 | 2024 | 2025 | 2026 |
|---|---|---|---|---|
| Paid media | 25.1% | 27.9% | 30.6% | 31.4% |
| Labor | not published | not published | 21.9% | 24.5% |
| Martech | 26.6% | not published | 22.4% | 19.4% |
| Agencies | not published | not published | 20.7% | not published |
Sources: Gartner 2026 CMO Spend Survey via Chief Marketer (2021 and 2026 values), Gartner 2024 release (27.9%), Gartner 2025 survey via Chief Marketer (2025 split). Samples are mostly companies above $1 billion in revenue.
Three more numbers show where the money goes:
- Digital is two-thirds of all marketing expenses. Digital channels accounted for 67.5% of total marketing expenses in 2026 (not just paid media), up from 54.9% in 2023 (Gartner via Chief Marketer).
- Awareness and conversion get 62.6% of total media spend, up more than 10% since 2024, while loyalty and retention media fell 29% over the same period to under 15% (Gartner’s June 2026 release, as distributed by Business Wire).
- Social media is 14.3% of the whole marketing budget at U.S. companies, with marketers forecasting 17.1% within a year and 23.1% within five years (The CMO Survey Topline Report 2026). The survey’s own history shows these 12-month forecasts overshoot actual spending by 2.1 points on average, so discount the 17.1%.
In revenue terms, 31.4% of a 7.8% budget is about 2.4% to 2.5% of revenue going to paid media at a large enterprise (my arithmetic on Gartner’s two figures; Gartner itself published 2.4% for 2025).
When your paid share should sit above or below 31%
The 31% figure is an average across billion-dollar companies with very different goals. My rule of thumb: go above it when buyers search for what you sell and the sales cycle is short (paid search captures demand that already exists), and go below it when deals come from referrals and long relationships, where content, events and people do more of the work. Gartner’s own data supports the direction of travel, not a fixed number: AI-mature marketing teams in the 2026 survey put more into loyalty and retention and less into digital channels than the average.
What percentage of revenue should go to marketing? By company size, type and industry
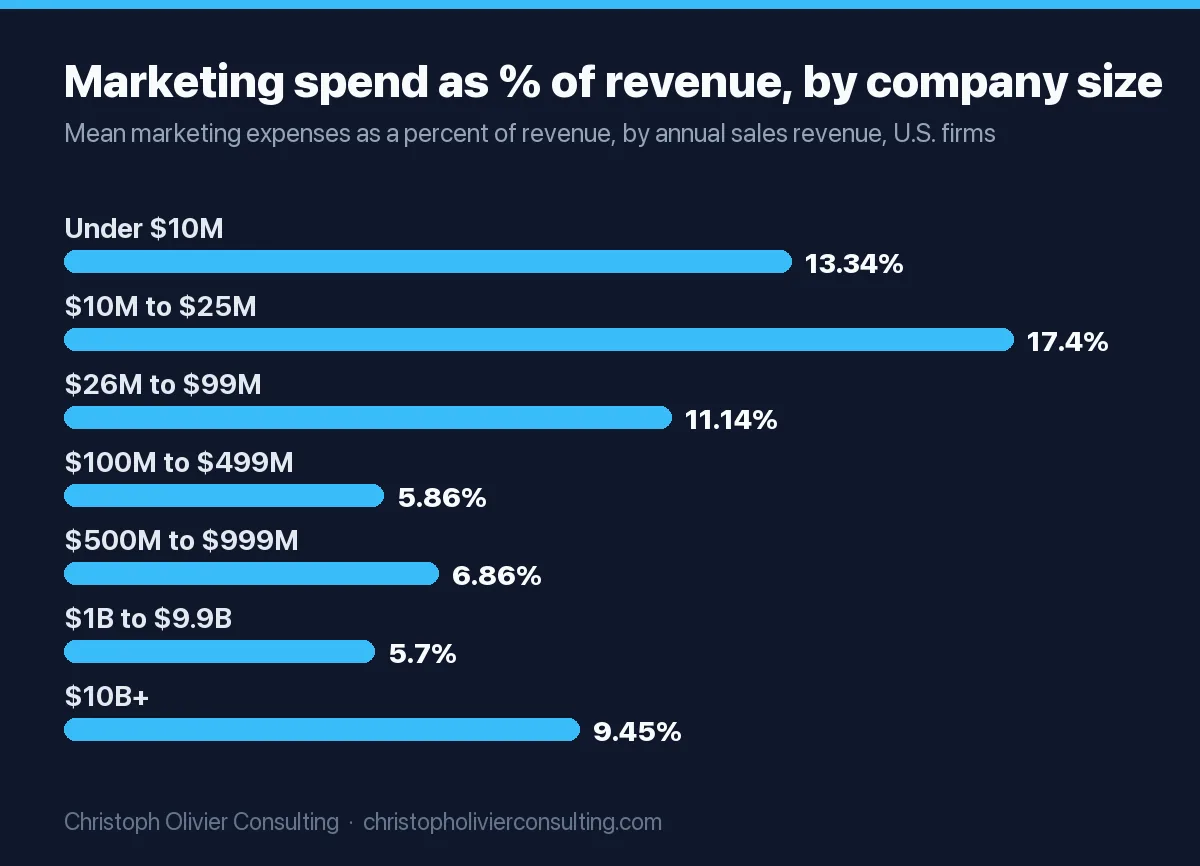
Pick the row that describes your company, not the headline average. The CMO Survey’s 2026 Firm and Industry Breakout Report splits the same question (“marketing expenses account for what percent of your company’s revenues?”) by revenue band, headcount, sector and online share. Means are shown; n is the number of companies answering.
| Company type or stage | Marketing as % of revenue | Source and sample |
|---|---|---|
| Small business under $5M revenue | 7% to 8% | SBA community blog, June 2012, assumes 10% to 12% margins after marketing |
| Under $10M revenue | 13.3% | The CMO Survey 2026, n=20 |
| $10M to $25M revenue | 17.4% | The CMO Survey 2026, n=15 |
| $26M to $99M revenue | 11.1% | The CMO Survey 2026, n=18 |
| $100M to $499M revenue | 5.9% | The CMO Survey 2026, n=34 |
| $500M to $999M revenue | 6.9% | The CMO Survey 2026, n=17 |
| $1B to $9.9B revenue | 5.7% | The CMO Survey 2026, n=33 |
| Large enterprise, mostly above $1B (NA, UK, Europe) | 7.8% | Gartner 2026 CMO Spend Survey, n=401 |
| Fewer than 50 employees | 16.3% | The CMO Survey 2026, n=23 |
| 50% to 99% of sales online | 18.6% | The CMO Survey 2026, n=11 |
| No online sales | 8.0% | The CMO Survey 2026, n=56 |
| Private B2B SaaS (share of ARR) | 8% median (sales: 15%) | SaaS Capital 2026 survey, 1,000+ companies |
The pattern is clear even with small samples: companies under $100 million spend roughly 11% to 17% of revenue, companies above $100 million spend roughly 6% to 7%, and the cross-company median is only 5% (mean 8.96%) in the 2026 Topline Report. Gartner adds that in 2025 half of CMOs reported budgets of 6% of revenue or less (Campaign Asia). The averages are pulled up by a minority of heavy spenders, so 5% to 7% is what a typical established company spends, and 10% or more is a growth-stage number.
Marketing budget by sector: B2B vs B2C, product vs services
| Sector (The CMO Survey 2026) | % of revenue | % of company budget | Overall spend change, prior 12 months | Digital spend change, prior 12 months |
|---|---|---|---|---|
| B2B product (n=61) | 7.0% | 7.0% | -0.2% | 4.1% |
| B2B services (n=41) | 10.1% | 9.2% | 2.8% | 7.1% |
| B2C product (n=34) | 12.0% | 13.8% | 0.9% | 12.6% |
| B2C services (n=18) | 7.2% | 11.5% | 8.0% | 16.6% |
| All companies | 9.0% | 9.6% | 1.7% | 8.2% |
Source: The CMO Survey Highlights and Insights Report 2026 and Firm and Industry Breakout Report. “Company budget” is a different denominator from revenue: it is marketing’s share of total company spending.
Marketing budget percentage by industry
| Industry | Marketing as % of revenue | n |
|---|---|---|
| Education | 18.4% | 5 |
| Communications and media | 18.0% | 6 |
| Real estate | 12.6% | 4 |
| Consumer packaged goods | 11.5% | 15 |
| Consumer services | 11.0% | 3 |
| Tech, software and platforms | 10.6% | 33 |
| Retail and wholesale | 8.8% | 10 |
| Banking, finance and insurance | 7.4% | 21 |
| Energy | 7.1% | 4 |
| Professional services | 6.8% | 12 |
| Pharma and biotech | 6.8% | 5 |
| Healthcare | 5.9% | 17 |
| Manufacturing | 5.6% | 13 |
| Transportation | 3.8% | 3 |
| Mining and construction | 0.4% | 3 |
Source: The CMO Survey Firm and Industry Breakout Report 2026, page 126. Treat any row with n under 10 as a single anecdote, not a benchmark. The five rows with 13 or more answers (tech, banking and insurance, healthcare, CPG, manufacturing) are the ones worth quoting.
Worked example: model next year’s budget from real CMO spend data
Here is the method I use, with the actual 2026 numbers plugged in, for a hypothetical B2B services firm with $12 million in revenue. Swap in your own revenue, sector and industry rows from the tables above.
- Set the floor at the median. 5% of $12M = $600,000. Below this, you are spending less than half of U.S. companies (CMO Survey median).
- Find your industry mean. Professional services, 6.84% x $12M = $820,800.
- Find your sector mean. B2B services, 10.07% x $12M = $1,208,400. This is your growth-mode ceiling.
- Ignore the size band if n is tiny or skewed. The $10M to $25M band reads 17.4% on 15 answers. It is too thin to plan on.
- Pick a number inside the range and tie it to a target. Say $1,000,000 (8.3% of revenue), justified by the pipeline it needs to produce. The step-by-step method for setting a marketing budget covers the pipeline math.
- Split it with the Gartner 2026 shares as a sanity check: paid media 31.4% = $314,000 (about $26,170 a month); labor 24.5% = $245,000; martech 19.4% = $194,000; everything else, including agencies, 24.7% = $247,000.
- Project next year. CMO Survey respondents expect overall marketing budgets to rise 7.61% on average over the next 12 months (median 5%). At the median, $1,000,000 becomes $1,050,000; at the mean, $1,076,100.
- Check affordability. The SBA rule of thumb assumed 10% to 12% margins after marketing. If your margin would drop below that, fund the gap with a measurable channel first, not a brand campaign.
Copy this worksheet into a spreadsheet and fill in the blanks:
| Line | Formula | Benchmark to use | Your number |
|---|---|---|---|
| A. Revenue (next year plan) | From finance | n/a | $______ |
| B. Floor | A x 5% | CMO Survey 2026 median | $______ |
| C. Industry mean | A x industry % | Industry table above | $______ |
| D. Sector ceiling | A x sector % | B2B/B2C table above | $______ |
| E. Chosen budget | Between B and D | Tied to pipeline target | $______ |
| F. Paid media | E x 31.4% | Gartner 2026 | $______ |
| G. Labor | E x 24.5% | Gartner 2026 | $______ |
| H. Martech | E x 19.4% | Gartner 2026 | $______ |
| I. AI line (overlaps F to H) | E x 15.3% | Gartner 2026 | $______ |
| J. Next-year budget | E x 1.05 | CMO Survey expected change, median | $______ |
Line I overlaps the others: Gartner reports AI as a share of the budget, and that money sits inside media, tools and people rather than on top of them. If you want a second pair of eyes on your split before it goes to the CFO, you can book a consultation.
Gartner CMO Spend Survey 2026 vs 2025: the numbers
Gartner’s survey is the enterprise benchmark. The 2026 edition was fielded January through March 2026 among 401 CMOs and marketing leaders in North America, the UK and Europe, the vast majority at companies above $1 billion in revenue (Gartner, May 11, 2026). The 2025 edition ran February through March 2025 with 402 respondents (Gartner, May 12, 2025).
| Metric | 2025 survey | 2026 survey |
|---|---|---|
| Marketing budget, % of company revenue | 7.7% | 7.8% |
| Paid media, % of marketing budget | 30.6% (2.4% of revenue) | 31.4% |
| Labor, % of marketing budget | 21.9% | 24.5% |
| Martech, % of marketing budget | 22.4% | 19.4% |
| CMOs saying budget is insufficient for strategy | 59% | 56% |
| AI initiatives, % of marketing budget | not published | 15.3% (21.3% at AI-ready teams) |
| Budget at AI-ready marketing teams, % of revenue | not published | 8.9% |
| CMOs planning to cut agency budgets | 39% | not published |
| CMOs planning to cut labor spending | 39% | not published |
| Respondents / field dates | 402 / Feb to Mar 2025 | 401 / Jan to Mar 2026 |
For the longer trend: Gartner’s 2024 release put budgets at 7.7%, down from 9.1% in 2023, and noted that budgets averaged 11% of revenue in the four years before the pandemic (Gartner 2024 release, reprinted by Insurance-Canada.ca). So the 2026 figure of 7.8% is a slight recovery from a post-pandemic low, not a return to pre-2020 levels.
The CMO Survey 2026: marketing budget as a percent of revenue, growth and cuts
The CMO Survey is run by Duke University’s Fuqua School of Business with Deloitte and the American Marketing Association. The 35th edition went to 2,111 marketing leaders at U.S. for-profit companies; 308 responded (14.6%), 97% at VP level or above, fielded January 7 to 29, 2026 (Topline Report). It is now an annual survey, and the next one is scheduled for January 2027.
| Metric (U.S. companies) | Fall 2024 | 2025 | 2026 |
|---|---|---|---|
| Marketing, % of company revenue | 7.7% | 9.4% | 9.0% (median 5%) |
| Marketing, % of overall company budget | 10.1% | 11.4% | 9.6% (median 7%) |
| Overall marketing spend change, prior 12 months | 5.8% | 3.3% | 1.7% |
| Digital marketing spend change, prior 12 months | 11.1% | 7.3% | 8.2% |
Sources: The CMO Survey Highlights and Insights Report 2026, trend charts on pages 51 to 53, and the Fall 2024 Highlights report. The 1.7% growth figure is the weakest since 2021, and 9.6% of company budget is the lowest share since 2021.
What’s the average budget growth marketers expect in 2026?
Marketers expect overall budgets to grow 7.61% over the next 12 months on average, with a median of 5%. Here is the expected change by area, from the 2026 Topline Report, page 42:
| Spending area | Expected change, next 12 months (mean) | Median |
|---|---|---|
| Digital marketing | +10.40% | +10% |
| Overall marketing | +7.61% | +5% |
| Brand building | +5.87% | +1% |
| New product introductions | +5.85% | +2% |
| Customer relationship management | +3.50% | 0% |
| New service introductions | +3.17% | 0% |
| Customer experience | +3.03% | 0% |
| Traditional advertising | -1.50% | 0% |
Two readings matter for planning. First, brand building’s median of +1% means most companies are holding brand budgets roughly flat while a few raise them sharply. Second, actual growth just slowed to 1.7%, and the survey’s own record shows 12-month social media forecasts overshoot by 2.1 points on average, so plan on the median, not the mean.
What programs are marketers reducing in 2026?
- Traditional advertising is the only area with an expected decline (-1.50%) and is down to 3.8% of marketing spending, from a pre-pandemic high of 5.8% (CMO Survey 2026).
- Loyalty and retention media fell 29% since 2024 in Gartner’s data, even though CMO Survey respondents report that retention is delivering stronger results. Acquisition budgets now run 26.0% larger than retention budgets, up from 19.6% a year earlier.
- Agencies and labor were the 2025 targets: 39% of CMOs planned to cut each (Gartner 2025). Labor’s share of the budget nonetheless rose to 24.5% in 2026.
- Marketing is first in line when profits miss. 53.1% of companies cut expenses rather than push growth when profits fall short, up from 46.0% a year ago, and marketing is the expense cut 45.4% of the time (CMO Survey 2026).
IAB Internet Advertising Revenue Report: full year 2024 and 2025 figures
The IAB/PwC report measures U.S. digital ad revenue, the supply side of the paid media budgets above. Full year 2024 came out April 17, 2025: $258.6 billion, up 14.9% (IAB/PwC Full Year 2024 report, PDF). Full year 2025, the 30th edition, came out April 16, 2026: $294.6 billion, up 13.9% (IAB release).
| Format | Full year 2024 | Growth 2024 | Full year 2025 | Growth 2025 |
|---|---|---|---|---|
| Total U.S. internet ad revenue | $258.6B | +14.9% | $294.6B | +13.9% |
| Search | $102.9B | +15.9% | $114.2B | +11% |
| Social media | $88.8B | +36.7% | $117.7B | +32.6% |
| Display | $74.3B | +12.4% | $81.6B | +9.8% |
| Digital video | $62.1B | +19.2% | $78.0B | +25.4% |
| Retail media networks (2024) / commerce media (2025) | $53.7B | +23.0% | $63.4B | +18% |
| Podcast | not extracted | +26.4% | $2.9B | +17.6% |
| Programmatic | $134.8B | +18.0% | not in release | n/a |
| Creator advertising | n/a | n/a | $37B (projected $44B in 2026) | n/a |
The format rows overlap (social includes social video, commerce media includes retail media), so they add up to more than the total. The 2024 row is retail media networks only, while 2025 reports the wider commerce media category, so do not read the two as a growth rate. In 2025 social passed search as the largest category, at 40.0% of total digital ad revenue against 38.8% for search. Both are free: the 2024 PDF downloads directly, and the 2025 report page asks you to create a free IAB account.
That growth explains the Gartner data: if U.S. digital ad revenue grows 13.9% while marketing budgets grow 1.7%, paid media has to take a bigger share of the budget just to buy the same reach. Gartner made the same point in 2025, noting that media price inflation means CMOs get less for every dollar. The platform-level numbers behind social’s $117.7 billion are in our social media marketing statistics for 2026.
AI and martech budgets: how CMOs are balancing the two
AI is being funded from inside a flat budget. Gartner’s 2026 survey found CMOs put 15.3% of the marketing budget into AI initiatives, while martech’s share fell to a five-year low of 19.4% (from 26.6% in 2021). Yet 62% of CMOs plan to invest more in martech, and 56% increased the share of martech spend on consumption-based pricing over the past year, against 9% who cut it (Chief Marketer). In plain terms: more AI tools, billed by usage, inside a smaller martech share.
The constraint is readiness, not cash. Only 30% of CMOs report mature AI readiness, and 70% say their marketing processes are not mature enough to scale AI (Gartner). The CMO Survey shows AI in 24.2% of marketing activities in 2026, up from 13.1% in 2024, with generative engine optimization (getting content into AI search answers) already used by 41.5% of companies. No martech activity scored above 5 on its 7-point performance scale, and lack of budget was the top barrier at 20.1%. If you are planning an enterprise AI budget, 15.3% of the marketing budget is the average, and 21.3% is what the most AI-ready teams spend. Our AI in marketing statistics set these Gartner figures next to McKinsey, HubSpot and Salesforce adoption data.
How to access real CMO spend data (free and paid)
You do not need a paid subscription to model next year’s budget. Here is what each source gives you for free, and what sits behind a paywall.
| Source | Who is surveyed | Free | Gated |
|---|---|---|---|
| The CMO Survey (Duke Fuqua, Deloitte, AMA) | 308 U.S. for-profit companies, all sizes, Jan 2026 | Topline, Highlights and Firm and Industry Breakout PDFs, with cuts by sector, industry, revenue and headcount | Nothing; raw respondent data is not shared |
| Gartner CMO Spend Survey | 401 marketing leaders, mostly above $1B revenue, NA/UK/Europe | Press releases with headline figures (May 2026 and June 2026 releases) | “Insights From the 2026 CMO Spend Survey” report, Gartner clients only |
| SaaS Capital spending benchmarks | 1,000+ private B2B SaaS companies, March 2026 | Median spend by function as % of ARR | None for the headline medians |
| IAB/PwC Internet Advertising Revenue Report | U.S. digital ad revenue (seller side) | Full report with a free IAB account | None |
| Forrester budget planning | B2B marketing decision-makers | Blog summary (83% expected increased investment for 2026) | Full 2026 planning guide, behind a contact form |
Is Gartner worth the cost just for CMO benchmarking data? For most companies under $100 million in revenue, no. Gartner’s sample is mostly billion-dollar enterprises, so its 7.8% average describes a company you probably are not. The CMO Survey’s free breakout report has the cuts you actually need, by revenue band, B2B vs B2C and industry. A Gartner seat earns its keep when you also use the analyst access and the wider research, not the spend survey alone. If you are comparing sources in detail, our breakdown of Gartner vs Forrester vs The CMO Survey goes source by source.
Is there a benchmark built from B2B CMOs rather than all-industry data? Yes, two: The CMO Survey’s B2B product and B2B services columns (61 and 41 companies in 2026), and SaaS Capital for software. Want to see the data before everyone else and help shape it? Senior marketing leaders at U.S. for-profit companies can sign up to be invited to the next CMO Survey.
Best benchmark for defending a frozen budget? Use two numbers together: Gartner’s 56% of CMOs who say their budget cannot deliver their 2026 strategy, and The CMO Survey’s finding that marketing is cut 45.4% of the time when profits miss. Then show your own cost per acquired customer against them, which our guide to calculating and defending marketing ROI walks through.
Frequently asked questions
What percentage of marketing budget should go to paid media?
About 30% to 31% is the current benchmark. Gartner's 2026 CMO Spend Survey puts paid media at 31.4% of the marketing budget, up from 30.6% in 2025, when it equaled 2.4% of company revenue. That sample is mostly companies above $1 billion in revenue, so go higher if your buyers search for what you sell and lower if deals come from referrals and long relationships.
What percentage of revenue should go to marketing?
Large enterprises spend 7.8% of revenue (Gartner 2026) and U.S. companies average 9.0%, with a median of 5% (The CMO Survey 2026). Companies under $100 million in revenue average roughly 11% to 17%, B2C product firms 12.0%, and B2B product firms 7.0%. The old SBA rule of thumb for businesses under $5 million is 7% to 8%, assuming 10% to 12% margins.
What did the IAB Internet Advertising Revenue Report full year 2024 show?
U.S. internet advertising revenue reached a record $258.6 billion in 2024, up 14.9%, per the IAB/PwC report released April 17, 2025. Search led at $102.9 billion, social reached $88.8 billion (up 36.7%), display $74.3 billion and digital video $62.1 billion. The full year 2025 report, released April 16, 2026, put revenue at $294.6 billion, up 13.9%.
Is Gartner worth the cost just for CMO benchmarking data?
For most companies under $100 million in revenue, probably not. Gartner's CMO Spend Survey samples mostly billion-dollar enterprises and its headline figures are free in press releases, while the full report is for Gartner clients. The CMO Survey's free Firm and Industry Breakout Report gives marketing spend by revenue band, B2B vs B2C and industry, which is usually more useful for a smaller firm.
What's the average budget growth marketers expect in 2026?
Respondents to The CMO Survey 2026 expect overall marketing budgets to grow 7.61% over the next 12 months on average, with a median of 5%. Digital marketing is expected to grow 10.40%, brand building 5.87% (median 1%) and traditional advertising to fall 1.50%. Actual overall growth over the prior 12 months was just 1.7%, the weakest since 2021.
How much of the marketing budget goes to AI in 2026?
Gartner's 2026 CMO Spend Survey found CMOs allocate 15.3% of the marketing budget to AI initiatives on average. Teams with mature AI readiness allocate 21.3% and run larger budgets overall, at 8.9% of revenue versus 7.8%. Only 30% of CMOs report mature AI readiness, and 70% say their processes are not ready to scale AI.
How do I access real CMO spend data to model next year's budget?
Download The CMO Survey's free Topline, Highlights and Firm and Industry Breakout PDFs from cmosurvey.org, read Gartner's free CMO Spend Survey press releases, and add SaaS Capital's free spending benchmarks if you sell software. Then apply your revenue to the median (5%), your industry mean and your sector mean to get a floor, a target and a ceiling.
More original research from CO Consulting
- Small Business Website Speed: A 320-Site Performance Study (2026)
- US Advertising and Marketing Industry Statistics 2026: Revenue, Employment, and Wages
- Consumer Trust in Advertising and Marketing Statistics for 2026
- The AI Search Readiness Study 2026: 15 Data Points on How Small-Business Websites Score for AI Citation
- Marketing Cost & CAC Benchmark by Industry 2026: The True Cost Per Acquired Client
- US Digital Advertising Spend: 42 Statistics, Trends, and Data Points for 2026
- 27 Local SEO and Google Business Profile Statistics and Data Points for 2026
- Podcast and Audio Advertising Statistics for 2026: 27 Verified Data Points